HotspotsConnector - A full-stack application for managing points of interest on maps
HotspotsConnector is a full-stack application that enables users to manage points of interest on maps and generate optimized routes using an external gRPC service.
- Year
- 2023
- Role
- Lead Software Engineer
- Duration
- 2 months
Gallery
Overview
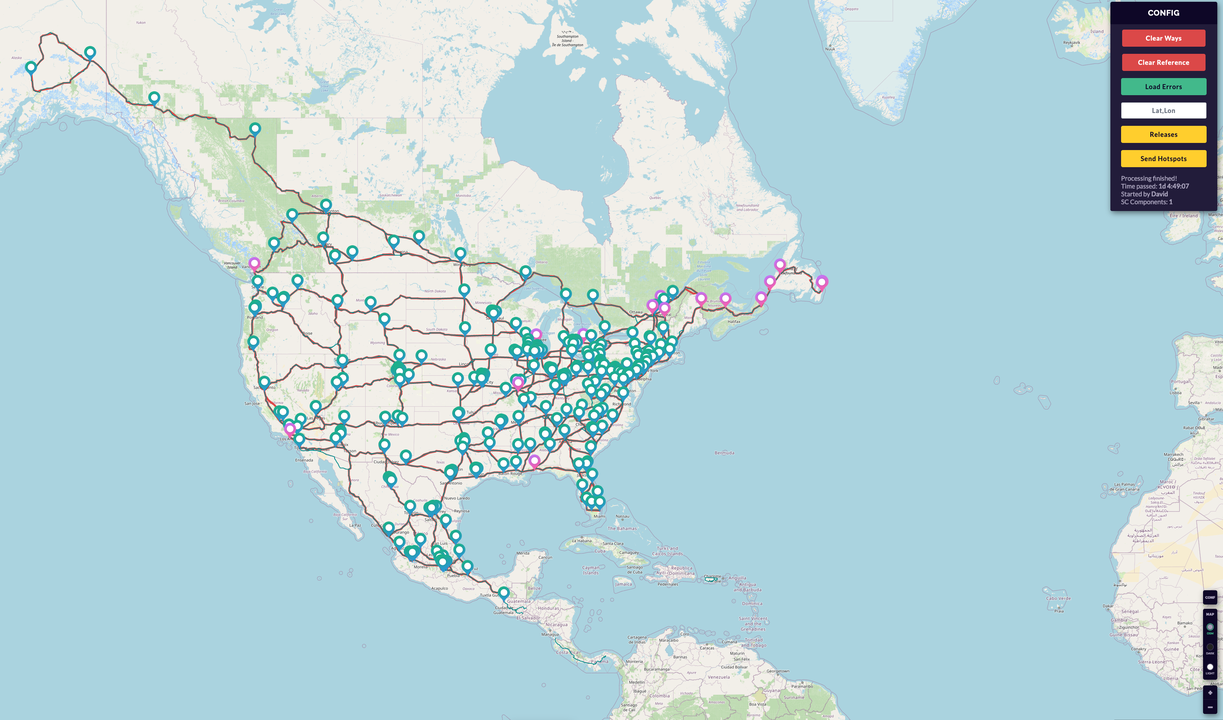
HotspotsConnector is a comprehensive full-stack application designed to facilitate the creation and management of points of interest (hotspots) on maps. The application allows users to easily add, move, and organize hotspots, which are then sent to an external routing service via a gRPC API to generate optimized routes connecting all points. With an intuitive frontend and a robust backend, HotspotsConnector streamlines the process of route planning and visualization for route optimization tasks.
Key Features
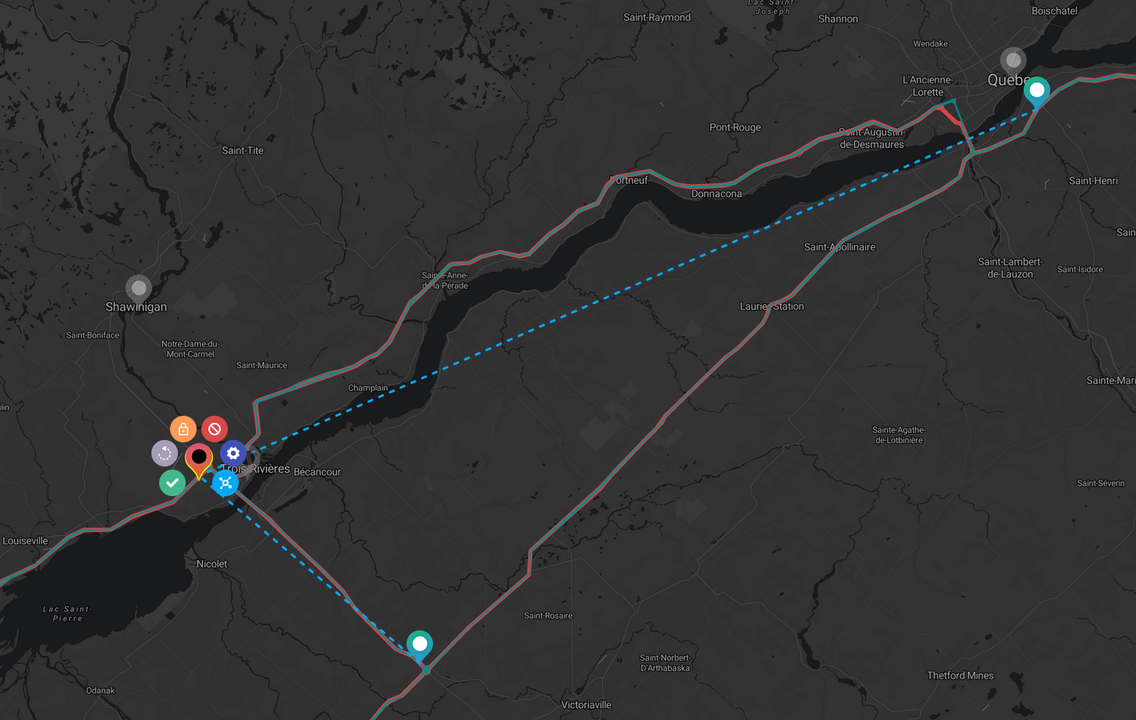
- User-Friendly Map Interface: An intuitive frontend that allows users to easily create, move, and manage hotspots on interactive maps.
- gRPC Integration: Seamless communication with an external routing service via gRPC API to send hotspot data and receive optimized routes.
- Real-Time Updates: Instant updates to the map as hotspots are added or modified, providing immediate visual feedback.
- Route Visualization: Clear and performant visualization of generated routes connecting all hotspots on the map.
- Scalable Backend: A robust backend architecture that efficiently handles multiple users and large datasets of hotspots.
- Collaboration Features: Support for multiple users to collaborate on hotspot management and route planning in real-time.
Technologies Used
Challenges & Solutions
Integrating gRPC communication within a web application to interact with the external routing service. Ensuring real-time synchronization of hotspot data among multiple users. Optimizing the performance of map rendering and route visualization with potentially large numbers of hotspots and routes.
Interested in working together?
Let's discuss your next project and how I can help bring it to life.